Global Settings
To configure statistical and maintenance settings, log in as an Admin User.
On the navigation menu  , expand the Admin section. Then select Global Settings.
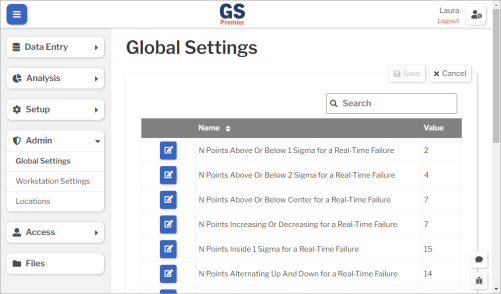
Real-Time Failure settings
Set these to match your desired method of flagging out-of-control conditions:
- Number of Points Above Or Below 1 Sigma for a Real-Time Failure
- Number of Points Above Or Below 2 Sigma for a Real-Time Failure
- Number of Points Above Or Below Center for a Real-Time Failure
- Number of Points Increasing Or Decreasing for a Real-Time Failure
- Number of Points Inside 1 Sigma for a Real-Time Failure
- Number of Points Alternating Up And Down for a Real-Time Failure
- Number of Points Outside 1 Sigma for a Real-Time Failure
For the Use Fixed or Dynamic Limits for Real-Time Failures setting:
- Fixed uses the Characteristic's Fixed Upper and Lower Control Limits, X Target (or the midpoint between limits if X Target is blank), and R Target (or the midpoint between limits if R Target is blank) to flag out-of-control conditions.
- Dynamic retrieves the most recent 25 subgroups entered for the Characteristic and re-calculates Control Limits and their midpoints to flag out-of-control conditions.
Statistics
Set these to match your desired method of calculating statistics:
- Standard Deviation Method
- Z-Values Method
Start of Day and Week
- First Day of Week
- Start of Day Offset (Minutes) : If the work week does not start at midnight on the First Day of Week, you can set this to a number from -720 (12 hours before midnight) to 719 (12 hours after midnight).
For example:
- To start the work week on Sunday at 11:00 PM, set the First Day of Week to "Monday" and the Start of Day Offset (Minutes) to "-60".
- To start the work week on Sunday at 7:00 AM, set the First Day of Week to "Sunday" and the Start of Day Offset (Minutes) to "420".
These settings affect Relative date periods such as:
- Current Day, Previous Day
- Current Week, Previous Week, Week to Date
- Current Month, Previous Month, Month to Date
- Current Quarter, Previous Quarter, Quarter to Date
- Current Year, Previous Year, Year to Date
Inactivity Timeout
When a user is logged in to GS, they will be automatically logged out after this many minutes of inactivity.
To disable automatic logout, set this to 0.
Cleanup Dev Data (days)
When an Admin or Engineer runs scripts in Developer Mode, the data they enter is specially flagged to exclude it from Production data.
You can set how many days to keep this Developer Mode data before automatically purging it from GS.
Customer Logo
You can brand your GS site by uploading and selecting your company logo.
It will be displayed at the top of all pages on your site.
![]()
Short Run Method
When performing Short Run analysis for multiple Characteristics, this determines how GS will plot X-bar and R values on Control Charts.
- Target/Nominal
- Each plot point on the X-bar chart is the deviation of each X from the Characteristic's X Target.
- The R chart is not affected by this setting.
- This is useful when all Characteristics on the chart have similar variability.
- Range
Minimum Impact for Insights
This sets a minimum percentage of the association with change in mean or variability when reporting Data Insights.
To report Data Insights for only the traceabilities with higher impacts on variability, increase this value.
Significance Level for Insights
This sets a minimum value of p for f-tests and t-tests when reporting Data Insights.
To report Data Insights for only the traceabilities with higher probabilities of statistical significance, decrease this value.