Quick Steps to create a COA Report
Overview
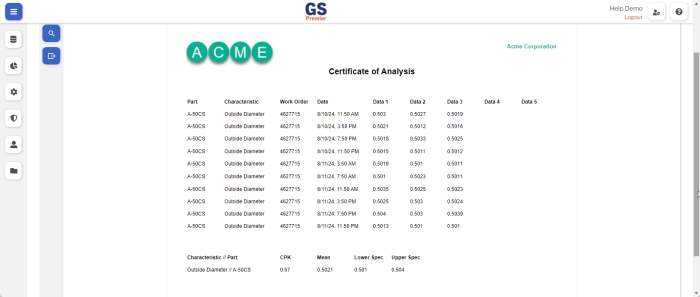
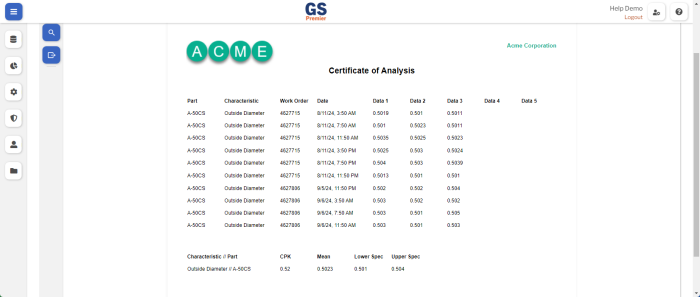
This tutorial will show you how to create a basic Certificate Of Analysis (COA) Report of SPC measurement data.
The features of this Report include:
- raw data
- statistics
- your company logo, company name, and report title in the header
- page numbers and print date/time in the footer
- ability to select any Part and Work Order (or similar Traceability such as Lot, Batch, etc.) when you run the Report
- ability to export to pdf
A. Create a new Report
You must be logged in as a User whose Role is Admin, Analyst, or Engineer to create a Report:
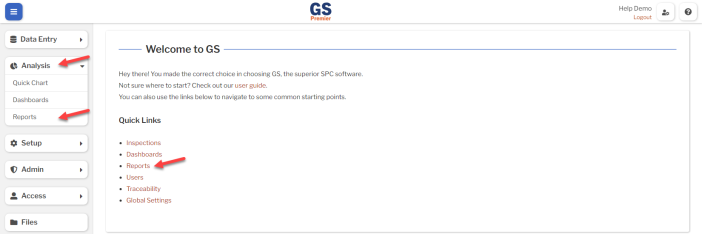
- On the navigation menu
 , expand the Analysis
  section. Then select Reports.
- Or select the Reports link on the GS home page.
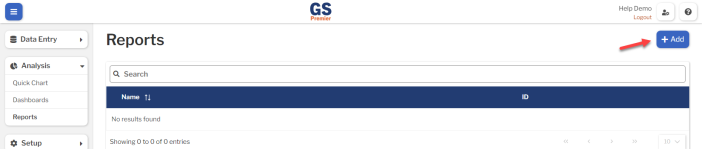
- Select the Add button to create a new Report.
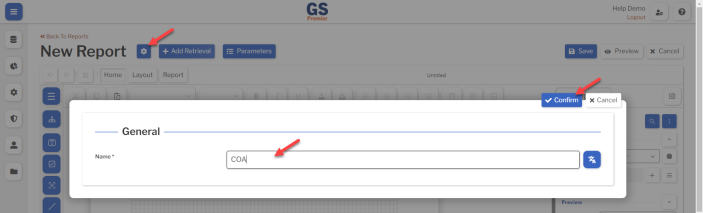
- Select the Settings button
 to set a Name for the Report, then select Confirm.
- This name will not be displayed on the Report.
- Save the Report by selecting the Save button or by pressing CTRL+S.

 Best practice is to Save frequently while you build and edit the Report.
B. Create a Retrieval
The Retrieval determines what data you are analyzing on the Report.
- Select the Add Retrieval button
 .
.
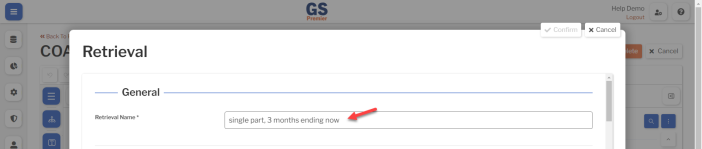
- Create a Retrieval Name. (It will not be displayed on the Report.)
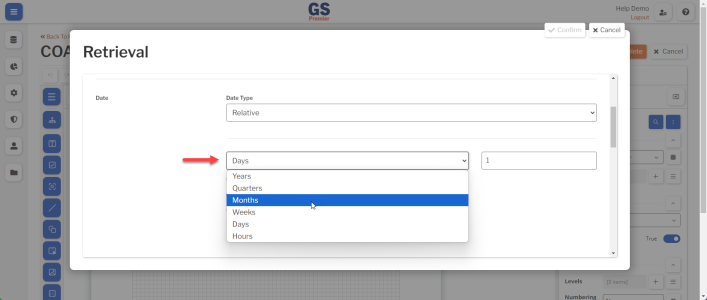
- In the Date section, set the date range you want to analyze.
- The default date range is Current Day (today).
- If you want to include any previous data:
- Choose a date increment such as Weeks, Months, and so forth.
- Select the type of date range such as Current, Previous, and so forth.

- For an option with 1, you can also change the number.

- Verify the date range.
- Choose a date increment such as Weeks, Months, and so forth.
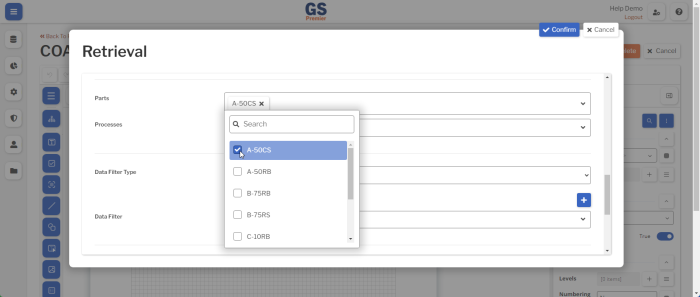
- Select the Parts list and then select a Part.
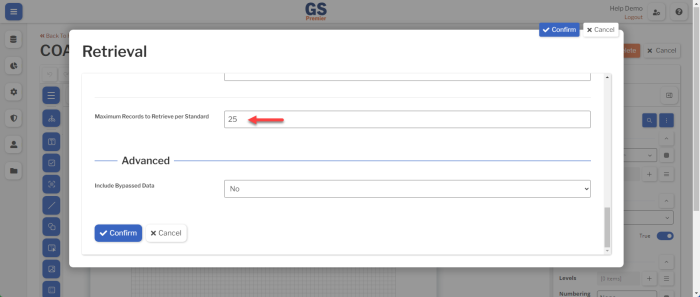
- To include more than 25 subgroups on the chart, increase the Maximum Records to Retrieve per Standard.
- A Standard is the combination of one Part and one Characteristic.
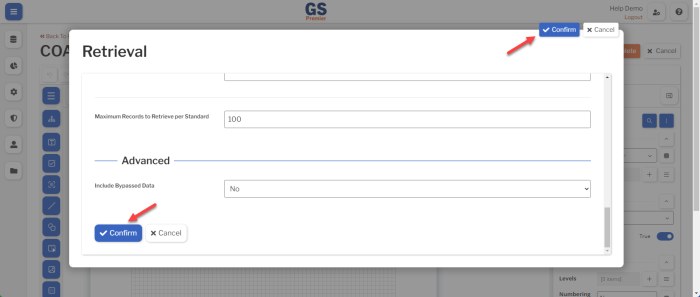
- Select Confirm to save your new Retrieval.
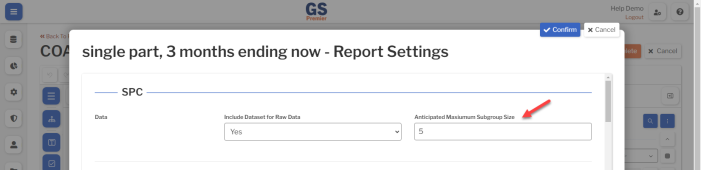
- Next, GS automatically prompts you to enter Report Settings for the new Retrieval.
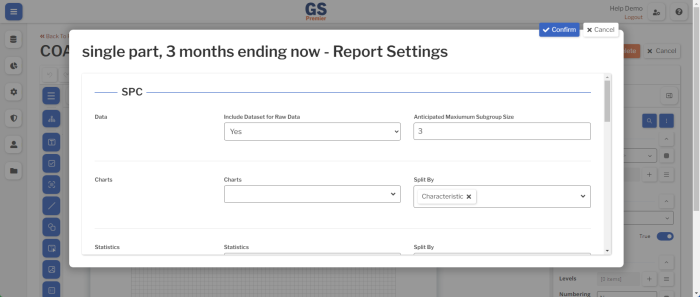
- Set the Anticipated Maximum Subgroup Size to the largest Subgroup Size for the Characteristics of the Parts you will select for this Report.
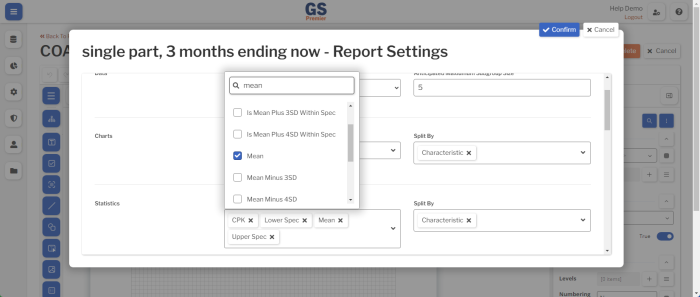
- Select the Statistics you want to report.
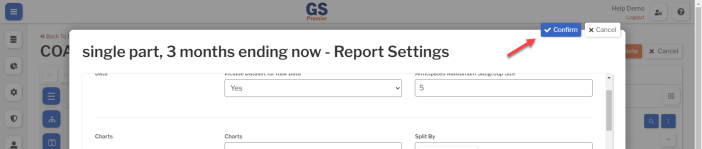
- Select Confirm to save your Report Settings for the Retrieval.
- If you need to edit this Retrieval or its Report Settings, select the Retrievals list and then select the Edit Retrieval button or the Select Data Types, Statistics, and Charts button
 for the Retrieval.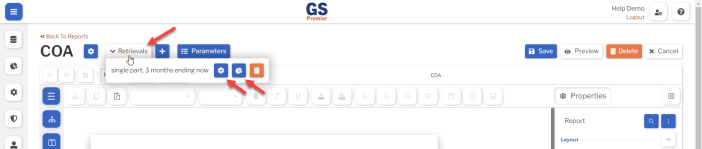


C. (optional) Change the Layout, Margins, and Page Size
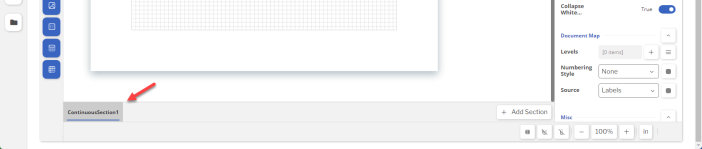
At the bottom of the page, select ContinuousSection1.
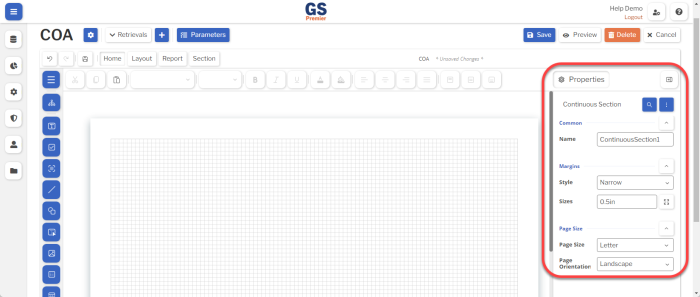
Then use the Properties panel on the right to:
- Change the Margins
- Change the Page Size
- Select a different Page Orientation (Portrait or Landscape)
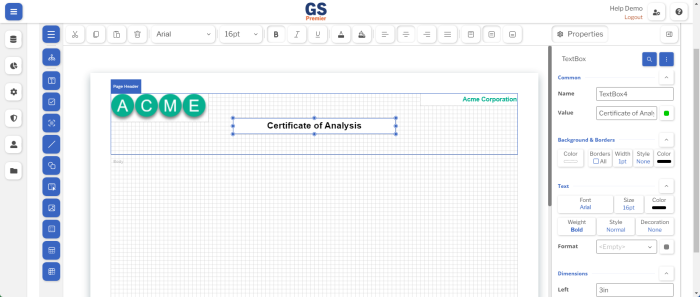
D. Add a Header with your company name and logo
- Right-click on the grid and then select Add Header.
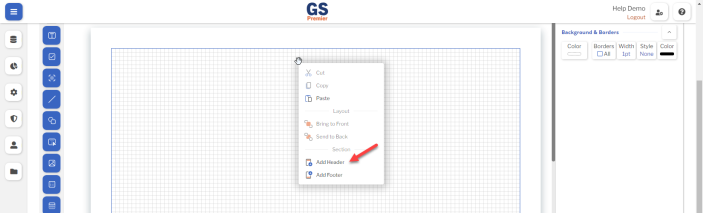
- This creates a Page Header section and a Body section.
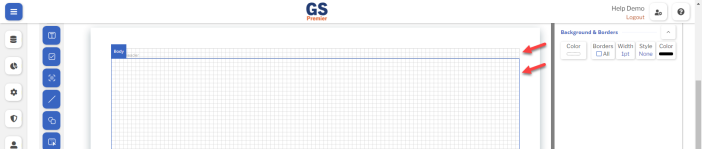
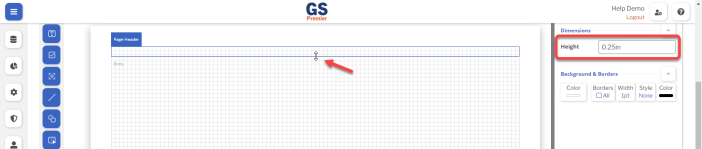
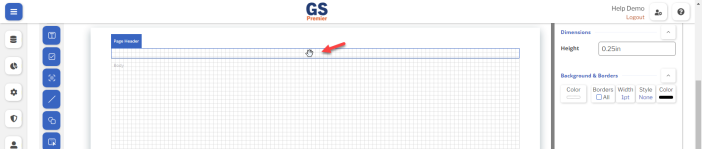
- Click above the Body to select the Page Header.
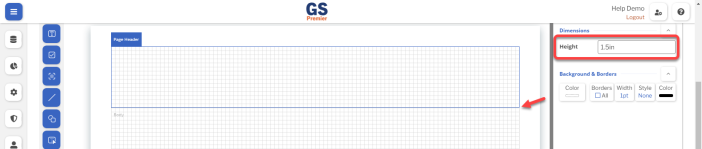
- Drag the bottom edge of the Page Header — or edit the Height property — so you will have enough space for your logo.
- Pro tip: When dragging items or their edges, two options can help you align them:
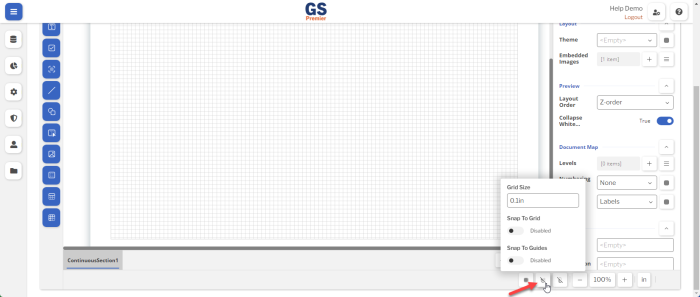
- Snap to Grid will automatically align the item you are dragging to the grid. You can also change the Grid Size.
- Snap to Guides helps you align the item you are dragging to other items on the Report.
- To add your company logo:
-
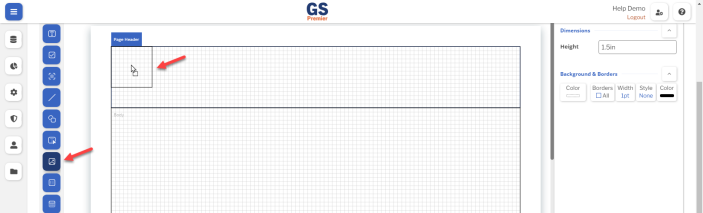
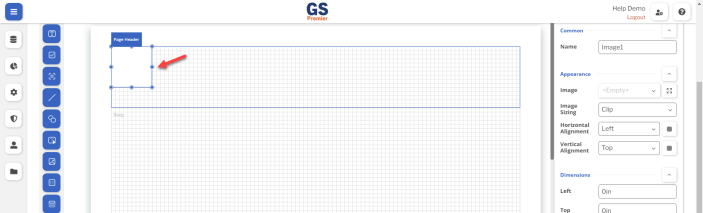
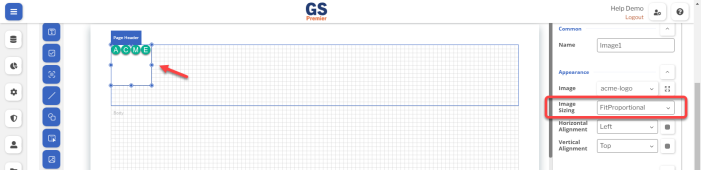
- Drag the Image control and drop it on the Page Header.
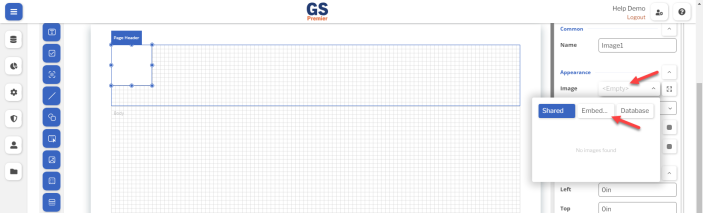
- Select the Image property and then select Embed.
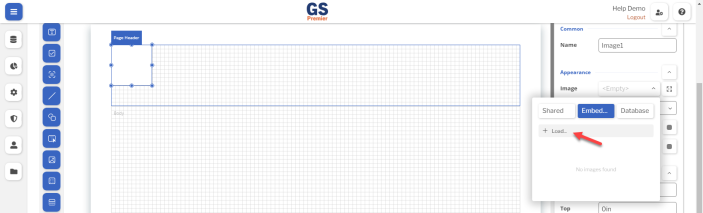
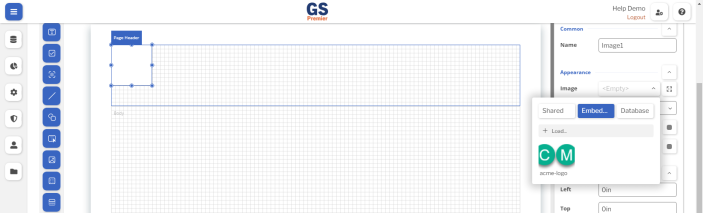
- Select + Load... and choose your company logo.
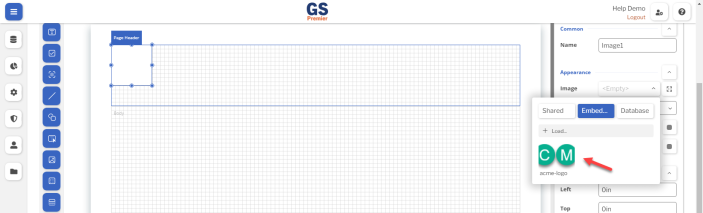
- Select your logo to display it on the Report.
- Change the Image Sizing property to FitProportional.
- Drag the sides or corners of the Image — or edit the Dimensions properties — to change its size.
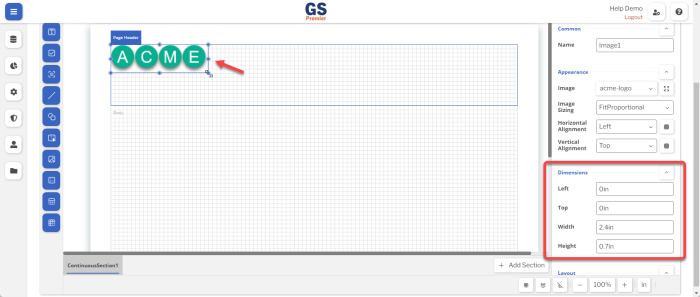
- Pro tip: For best results, leave some white space at the bottom of the Page Header (like the example shown above).
If a Table is too long to fit on one page, it will continue at the top of the Body on subsequent pages.
- Drag the Image control and drop it on the Page Header.
-
- To add your company name:
-
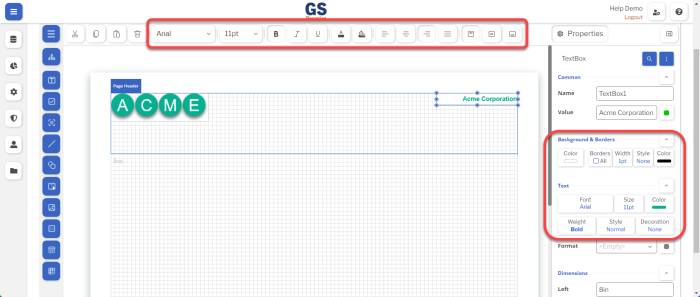
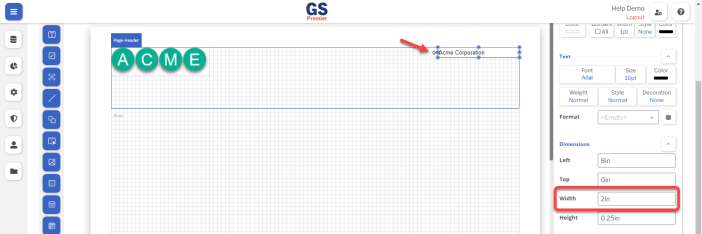
- Drag the TextBox control and drop it on the Page Header.
- Enter your company name in the Value property and then press ENTER.
- Drag the sides or corners of the TextBox — or edit the Width property — so the TextBox is large enough to display your company name.
- Use the text styling toolbar or properties to make the text Bold or apply a different font, font size, color, border, text alignment, and so forth.
- You can also select the TextBox Properties menu button
 to show or hide Advanced Properties.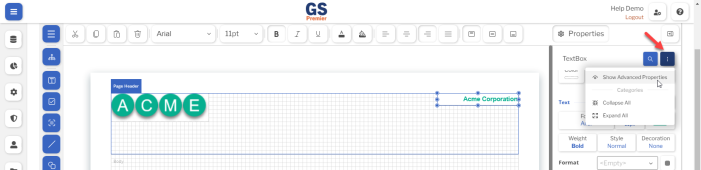
- Drag the TextBox control and drop it on the Page Header.
-
- To add the report title to the header, repeat the methods from the previous step (adding your company name).
- Remember to leave some white space at the bottom of the Page Header.




E. Add a Footer with page numbers and the print date/time
- Right-click on the grid and then select Add Footer.
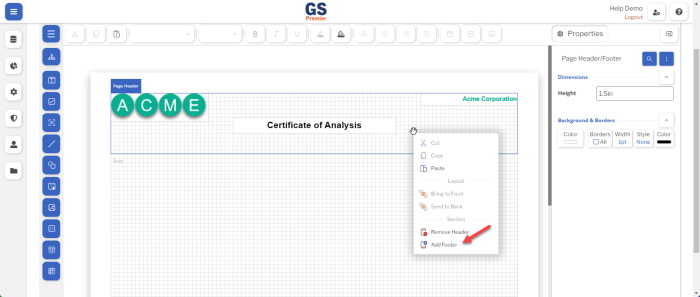
- This creates a Page Footer section.
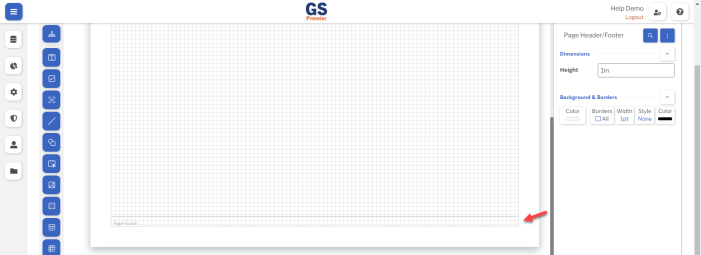
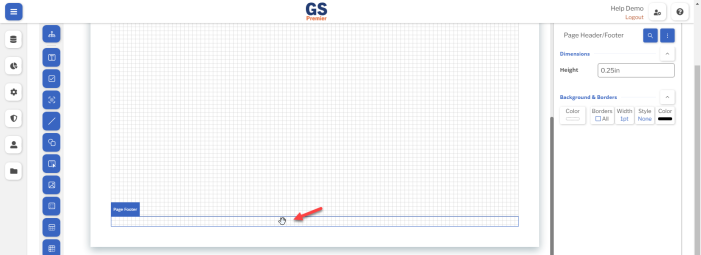
- Click below the Body to select the Page Footer.
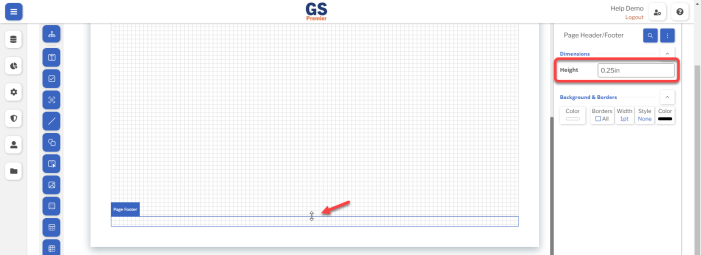
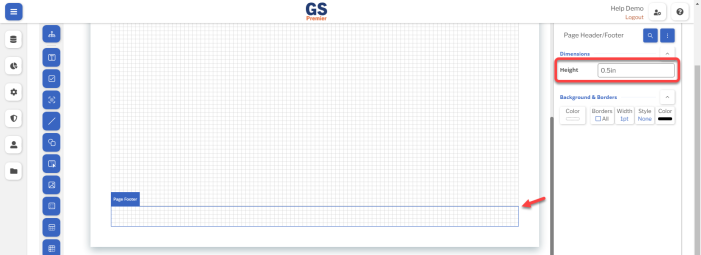
- Drag the top edge of the Page Footer — or edit the Height property — so you will have enough space for a page number and print date.
- To add page numbers:
-
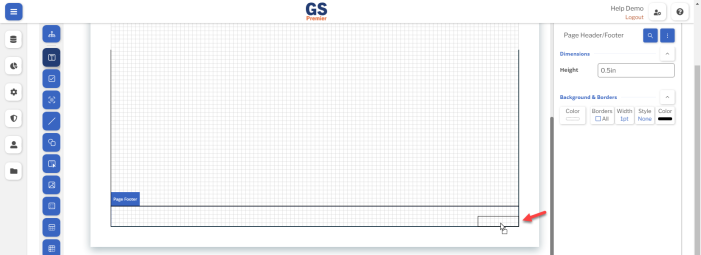
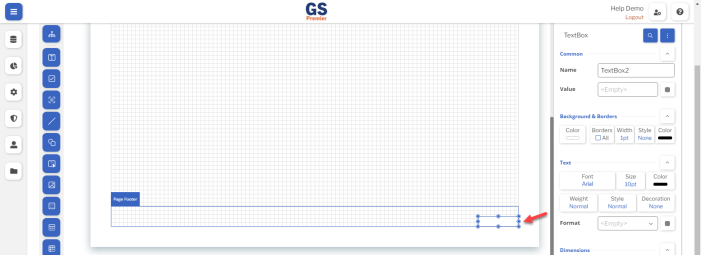
- Drag the TextBox control and drop it on the Page Footer.
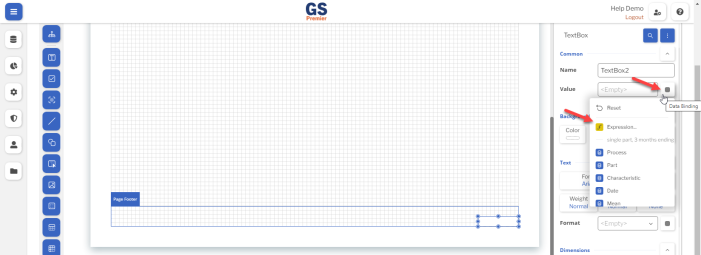
- For the Value property, select the Data Binding button and then select Expression.
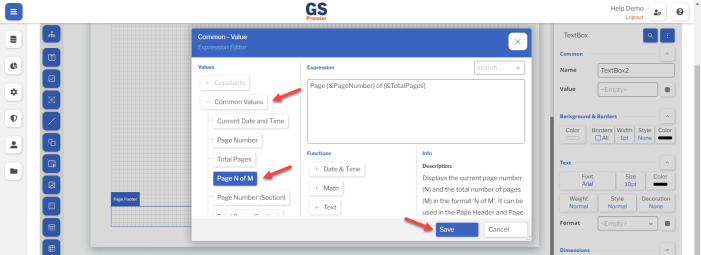
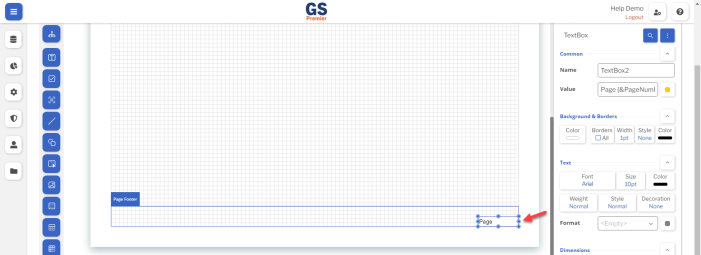
- Select the Common Values button, double-click the Page N of M button, and then select the Save button.
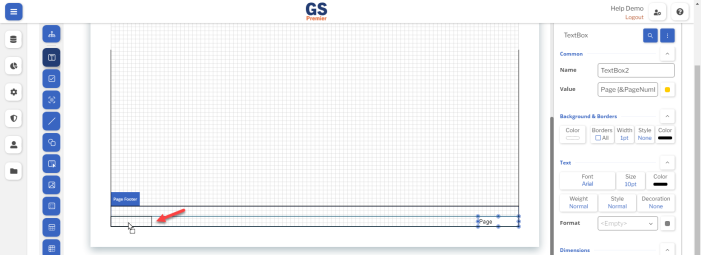
- Drag the TextBox control and drop it on the Page Footer.
-
- To add the print date and time:
-
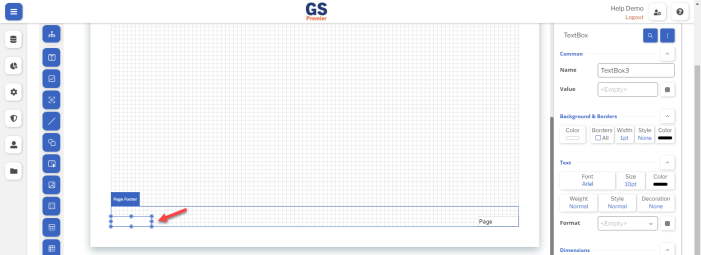
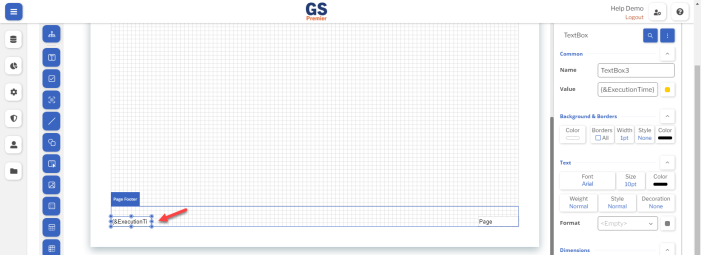
- Drag the TextBox control and drop it on the Page Footer.
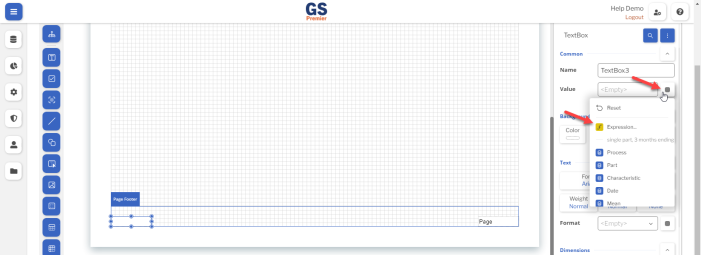
- For the Value property, select the Data Binding button and then select Expression.
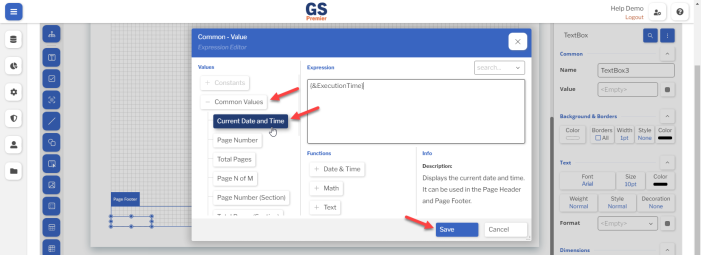
- Select the Common Values button, double-click the Current Date and Time button, and then select the Save button.
- Drag the TextBox control and drop it on the Page Footer.
-
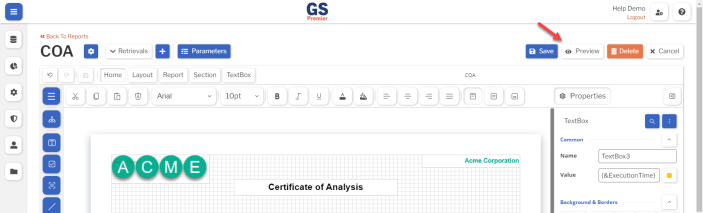
- To see how these footer values will actually appear when you run the Report, select the Preview button.
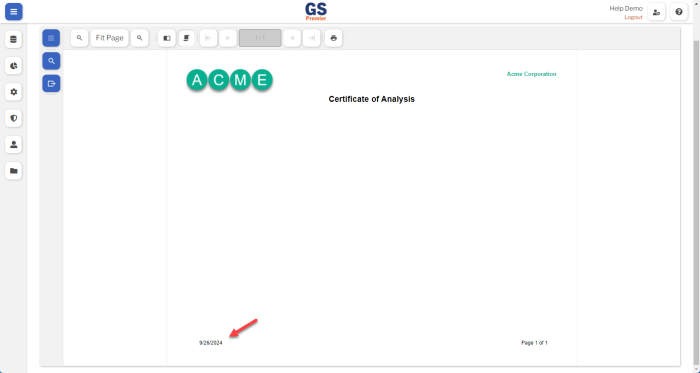
- As you can see, the TextBox for the print date and time is too narrow to display both the date and time:
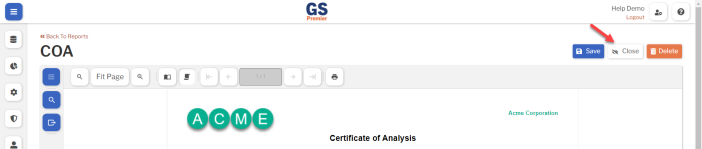
- To return to the Report editor, select the Close button.
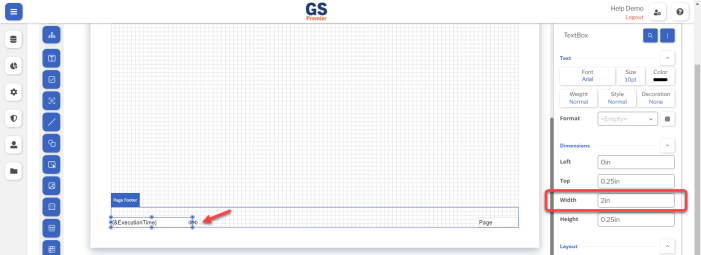
- Then you can drag the right edge of the TextBox — or edit its Width property — to make it wider.
- You can also select the Text Align Left button on the text styling toolbar to align the text to the left side of the TextBox.
F. Add a table of raw Data
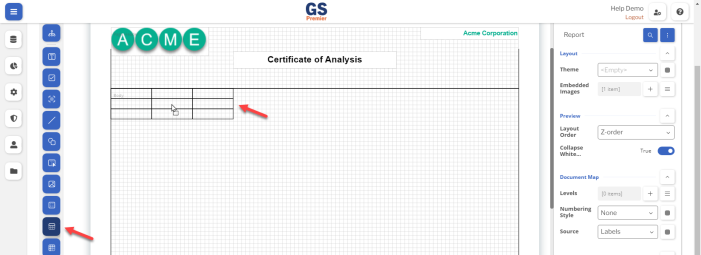
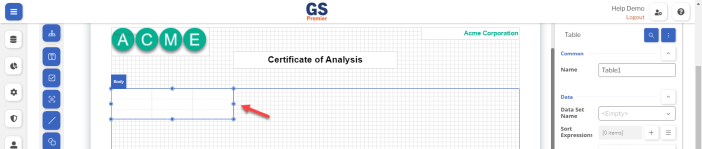
- Drag the Table control and drop it on the Body.
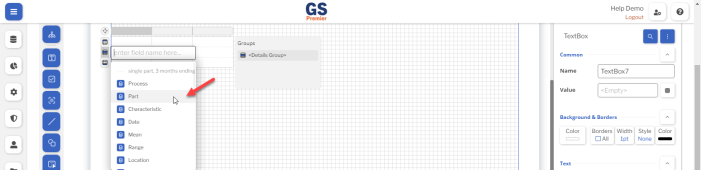
- Hover on the first cell in the middle row, select the ellipsis, and then choose Part.
- Repeat the previous step for the next two cells in the middle row, setting them to Characteristic and Work Order (or similar Traceability).
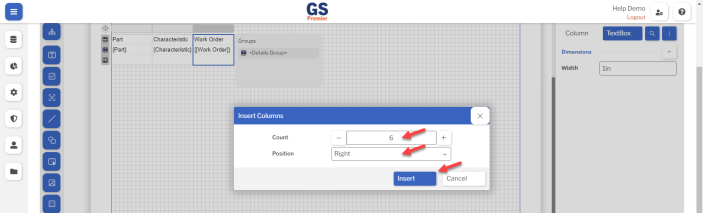
- For this Table of raw data, we need to add six more columns - one for each record's Date Time and five for the Anticipated Maximum Subgroup Size we set in the Retrieval.
- To do this:
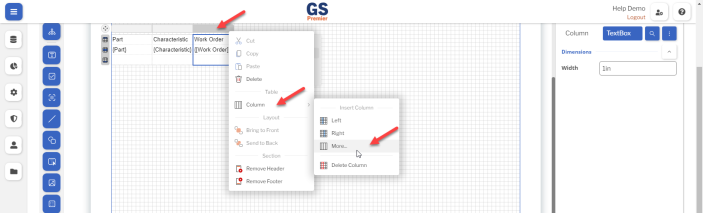
- Right-click the gray column header on the last column, point to Column, and select More.
- Set the Count to 6, set the Position to Right, and then select Insert.
- Right-click the gray column header on the last column, point to Column, and select More.
- To do this:
- Set the remaining cells in the middle row to Date, Data 1, Data 2, Data 3, Data 4, and Data 5, using the same method you used to set the Part cell.
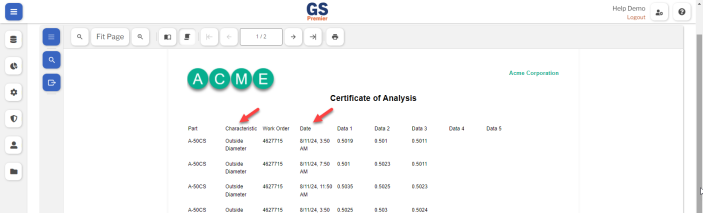
- Select the Preview button to see how this Table will actually appear when you run the Report.
- As you can see, the information you placed in the middle row of the Table is repeated for each row of the data set from your Retrieval.
- We also notice that the columns for Characteristic and Date are too narrow:
- To return to the Report editor, select the Close button.
- To make a column wider, you can drag the right edge of the gray column header, or select the column header and then edit its Width property.







G. Add a table of Statistics
To add a table of Statistics, repeat the methods from the previous section (adding a table of raw Data) — but this time, select the statistics from your Retrieval.
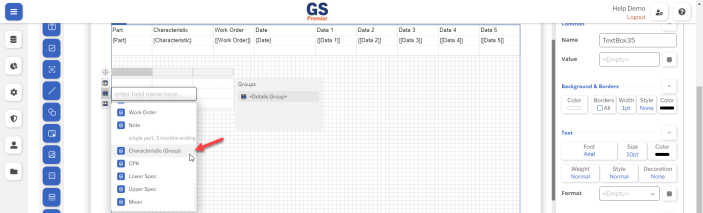

If desired, you can change any column heading by selecting the cell in the top row and editing its Value property.

H. Set the Part and Work Order at runtime
Finally, you can make this Report useful for any Part and any Work Order (or similar Traceability):
-
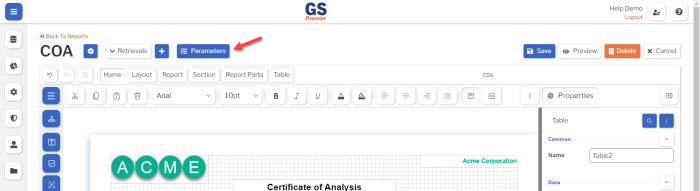
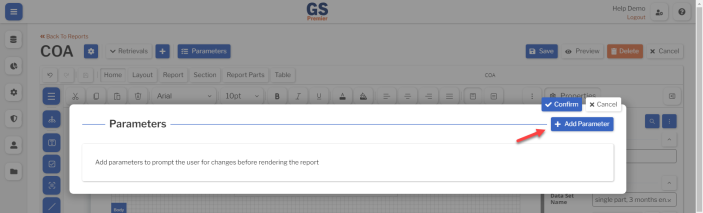
- Select the Parameters button.
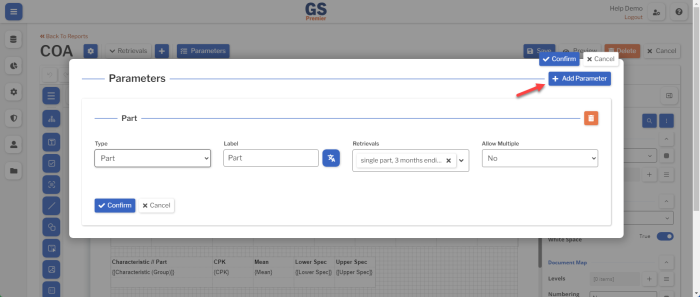
- Add a Part parameter:
-
- Select the Add Parameter button.
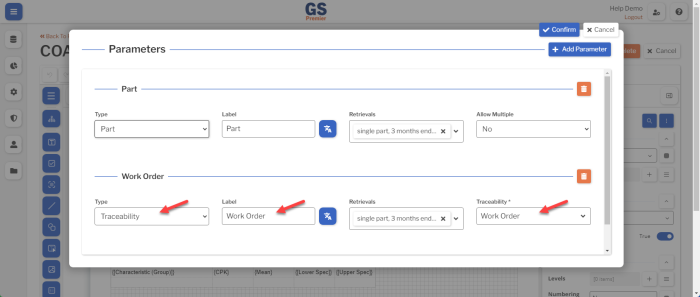
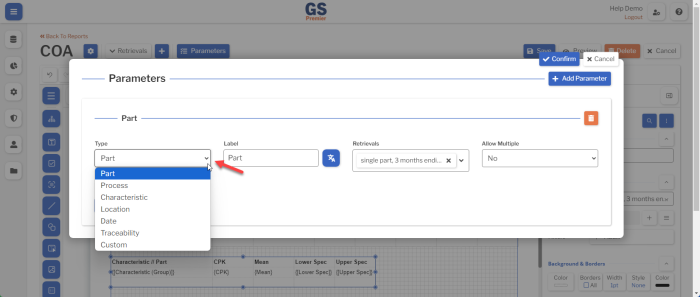
- Change the Type to Part.
- Select the Add Parameter button.
-
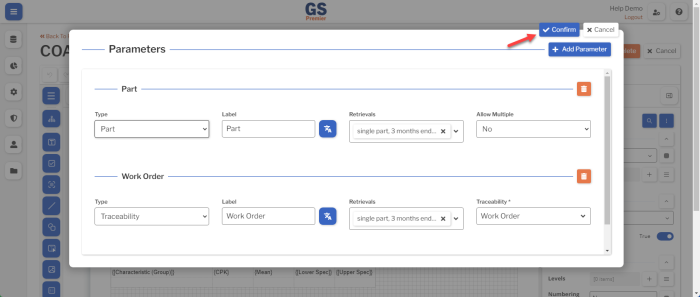
- Add a Work Order (or similar) parameter:
-
- Select the Add Parameter button.
- On the new Parameter:
- Change the Type to Traceability.
- Change the Label to "Work Order" (or similar).
- Change the Traceability to Work Order (or similar).
- Select Confirm.
- Select the Add Parameter button.
-
- To see how these Parameters work, select the Preview button.
- When prompted, enter a Part and a Work Order and then select Confirm.
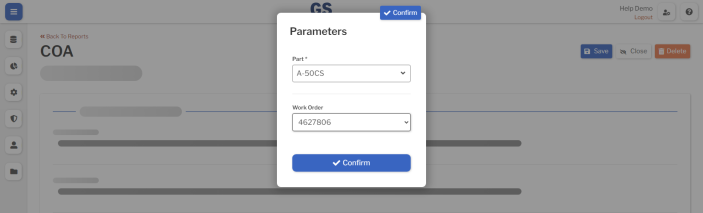
- When you run this Report, it will filter your data for the Parameters you have selected. (Corresponding selections in your Retrieval — such as the Part you initially selected — will be ignored.)
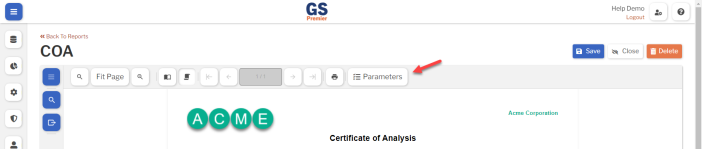
- To change the Parameters, select the Parameters button on the Preview page.
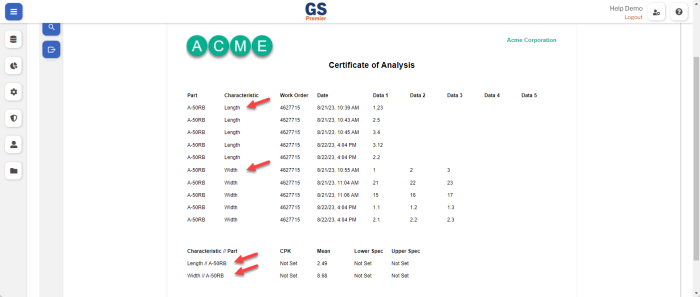
- Note how selecting a Part with multiple Characteristics will list them on the Report:
- Save the Report by selecting the Save button or by pressing CTRL+S.
- When finished, select the Back to Reports link at the top of the page.

View the Report and export to pdf
Any User with permission to run Reports can perform these steps:
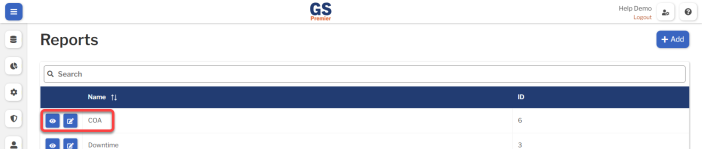
- On the navigation menu , expand the Analysis section. Then select Reports.
- Or select the Reports link on the GS home page.
- Select the View
 button for the Report you want to run.
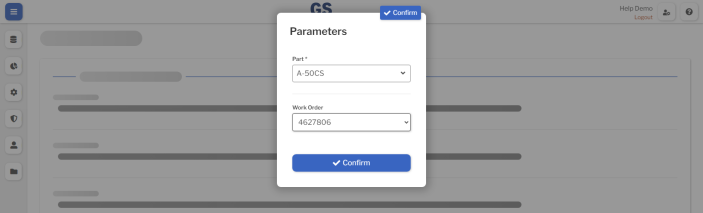
- When prompted, enter a Part and a Work Order (or similar) and then select Confirm.
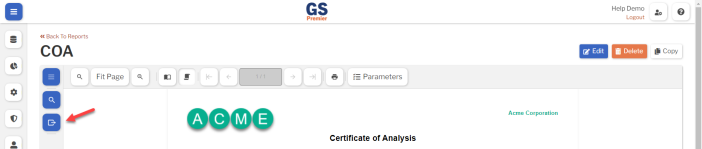
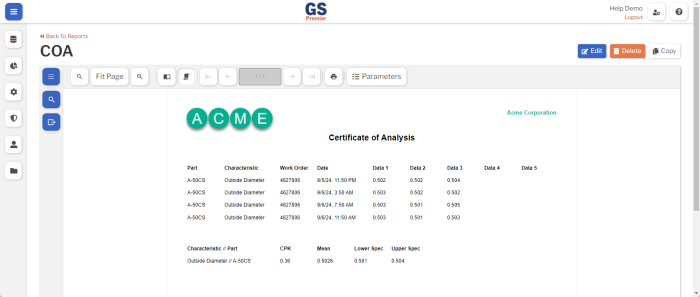
- This displays the Report for the Part and Work Order you selected:
- To change the Part or Work Order, select the Parameters button:
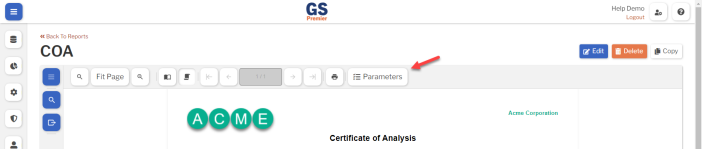
- To export this Report to pdf:
-
- Select the Export button.
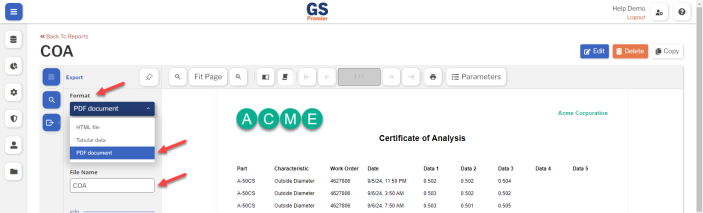
- Change the Format to PDF document and set the File Name.
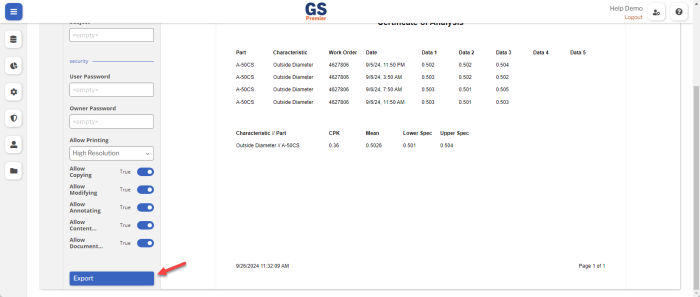
- Scroll to the bottom of the Export menu and select the Export button.
- Select the Export button.
-