Scripting Documentation and Examples
Scripting Documentation
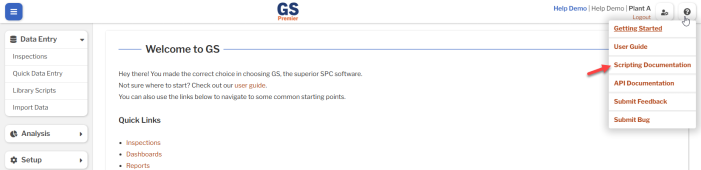
The full Scripting Documentation is available from the Help menu  anywhere in GS.
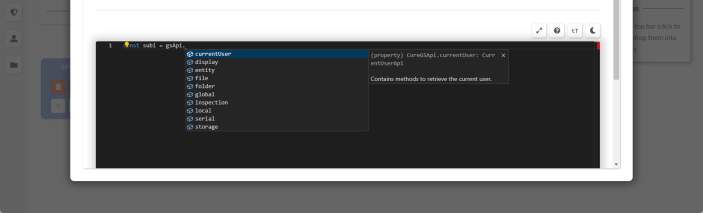
When editing a Script, you can type gsApi. to browse the gsAPI commandset and auto-complete any of its commands.
Example Scripts
Here are some example Scripts that show how the gsApi commandset can be used.
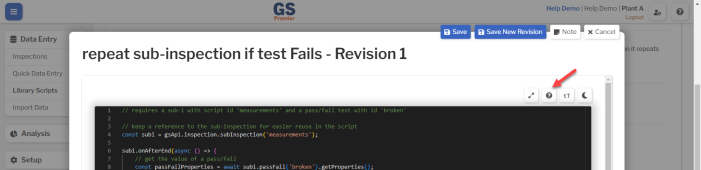
Repeat sub-inspection if test fails
This Inspection Script gets the value of a Pass/Fail Test on a Sub-Inspection that was just submitted.
If the value of the Pass/Fail Test is "Fail", then it repeats the Sub-Inspection.
It requires a Sub-Inspection with Script ID measurements and a Pass/Fail Test with Script ID broken.
// keep a reference to the sub-inspection for easier reuse in the script
const subi = gsApi.inspection.subInspection('measurements');
subi.onAfterEnd(async () => {
// get the value of a pass/fail
const passFailProperties = await subi.passFail('broken').getProperties();
// redirect to the current sub-inspection if it failed
if (passFailProperties.value === 'fail') {
gsApi.inspection.goToSubInspection('measurements');
}
});
Get SPC measurements from a file
This Inspection Script reads a local file and sets the value of an SPC Test to the contents of the file.
It requires:
- a Sub-Inspection with Script ID measurements
- a Button Test with the Script ID read
- an Input Test with Script ID filepath
- an SPC Test with Script ID diameterx
- a file on the workstation that contains one line of comma-separated measurement values for the subgroup. (whitespace will be ignored)
- GS Local installed on the workstation
// keep a reference to the sub-inspection for easier reuse in the script
const subi = gsApi.inspection.subInspection('measurements');
subi.button('read').onClick(async () => {
// get the file path from an input test on the same sub-inspection
// make sure the user actually filled out the input before continuing
const filePath = (await subi.input('filepath').getProperties()).value;
if (typeof filePath !== 'string') {
return;
}
// load the file and split its contents by comma, parsing each item from a string into a number
const fileHandle = await gsApi.local.file.open(filePath, 'read');
const allContents = await fileHandle.readToEnd();
const values = allContents.split(',').map(x => parseFloat(x));
// map the values to a list of objects that are accepted by the SPC test's .updateProperties() function
const spcTestValues = values.map(x => {
return {
value: x
};
});
await subi.spc('diameterx').updateProperties({
value: spcTestValues
});
});
Draw a Cpk gauge for each Part in the Retrieval
This Dashboard Script draws a Cpk gauge chart for each Part in the Retrieval.
It requires a Retrieval with Script ID basic retrieval and a Scripted Chart control with Script ID scripted chart.
// keep a reference to the chart for easier use later on
const customChart = gsApi.dashboard.scriptedChart('scripted chart');
gsApi.dashboard.onReady(async () => {
// tell the retrieval to also retrieve stats for each part whenever it is refreshed
const alsoRetrieve = await gsApi.dashboard.retrieval('basic retrieval').alsoRetrieveWhenRefreshed([{
type: 'stats',
id: 'myCustomStats',
splitBy: ['part'],
stats: {
spc: ['cpk']
}
}]);
alsoRetrieve.onRetrieved(async (event) => {
// find the stats detail in the response when the retrieval is refreshed
const statsDetails = event.data.response.stats?.myCustomStats.spc;
if (!statsDetails) {
return;
}
// create an array of plotly.js charts to draw. Each item in the array represents a gauge chart that will be drawn for that part's cpk
const graphData = [];
const promises = statsDetails.map(async (detail) => {
const partId = /** @type number */(detail.splitByValues.find(x => x.type === 'part')?.value);
const part = await gsApi.entity.getPartById(partId);
graphData.push({
data: [{
value: detail.stats.cpk,
title: { text: part.name },
type: "indicator",
mode: "gauge+number",
gauge: {
axis: { range: [null, 3], tickwidth: 1, tickcolor: "darkblue" },
bar: { color: "darkblue" },
steps: [
{ range: [0, 1], color: "green" },
{ range: [1, 2], color: "yellow" },
{ range: [2, 3], color: "red" }
]
}
}],
layout: {}
});
});
await Promise.all(promises);
await customChart.draw(graphData);
});
});
See also